
The central library for Metrics is metrics-core, which provides some basic functionality:
All metrics are created via either the Metrics class or a MetricsRegistry. If your application is running alongside other applications in a single JVM instance (e.g., multiple WARs deployed to an application server), you should use per-application MetricsRegistry instances. If your application is the sole occupant of the JVM instance (e.g., a Dropwizard application), feel free to use the static factory methods on Metrics.
For this documentation, we’ll assume you’re using Metrics, but the interfaces are much the same.
Each metric has a unique metric name, which consists of four pieces of information:
The factory methods on Metrics and MetricsRegistry will accept either class/name, class/name/scope, or MetricName instances with arbitrary inputs.
A gauge is the simplest metric type. It just returns a value. If, for example, your application has a value which is maintained by a third-party library, you can easily expose it by registering a Gauge instance which returns that value:
Metrics.newGauge(SessionStore.class, "cache-evictions", new Gauge<Integer>() {
    @Override
    public Integer value() {
        return cache.getEvictionsCount();
    }
});
This will create a new gauge named com.example.proj.auth.SessionStore.cache-evictions which will return the number of evictions from the cache.
Given that many third-party library often expose metrics only via JMX, Metrics provides the JmxGauge class, which takes the object name of a JMX MBean and the name of an attribute and produces a gauge implementation which returns the value of that attribute:
Metrics.newGauge(SessionStore.class, "cache-evictions",
                 new JmxGauge("net.sf.ehcache:type=Cache,scope=sessions,name=eviction-count", "Value"));
A ratio gauge is a simple way to create a gauge which is the ratio between two numbers:
public class CacheHitRatio extends RatioGauge {
    private final Meter hits;
    private final Timer calls;

    public CacheHitRatio(Meter hits, Timer calls) {
        this.hits = hits;
        this.calls = calls;
    }

    public double getNumerator() {
        return hits.oneMinuteRate();
    }

    public double getDenominator() {
        return calls.oneMinuteRate();
    }
}
This custom gauge returns the ratio of cache hits to misses using a meter and a timer.
A percent gauge is a ratio gauge where the result is normalized to a value between 0 and 100. It has the same interface as a ratio gauge.
A counter is a simple incrementing and decrementing 64-bit integer:
final Counter evictions = Metrics.newCounter(SessionStore.class, "cache-evictions");
evictions.inc();
evictions.inc(3);
evictions.dec();
evictions.dec(2);
All Counter metrics start out at 0.
A Histogram measures the distribution of values in a stream of data: e.g., the number of results returned by a search:
final Histogram resultCounts = Metrics.newHistogram(ProductDAO.class, "result-counts");
resultCounts.update(results.size());
Histogram metrics allow you to measure not just easy things like the min, mean, max, and standard deviation of values, but also quantiles like the median or 95th percentile.
Traditionally, the way the median (or any other quantile) is calculated is to take the entire data set, sort it, and take the value in the middle (or 1% from the end, for the 99th percentile). This works for small data sets, or batch processing systems, but not for high-throughput, low-latency services.
The solution for this is to sample the data as it goes through. By maintaining a small, manageable sample which is statistically representative of the data stream as a whole, we can quickly and easily calculate quantiles which are valid approximations of the actual quantiles. This technique is called reservoir sampling.
Metrics provides two types of histograms: uniform and biased.
A uniform histogram produces quantiles which are valid for the entirely of the histogram’s lifetime. It will return a median value, for example, which is the median of all the values the histogram has ever been updated with. It does this by using an algorithm called Vitter’s R), which randomly selects values for the sample with linearly-decreasing probability.
Use a uniform histogram when you’re interested in long-term measurements. Don’t use one where you’d want to know if the distribution of the underlying data stream has changed recently.
A biased histogram produces quantiles which are representative of (roughly) the last five minutes of data. It does so by using a forward-decaying priority sample with an exponential weighting towards newer data. Unlike the uniform histogram, a biased histogram represents recent data, allowing you to know very quickly if the distribution of the data has changed. Timers use biased histograms.
A meter measures the rate at which a set of events occur:
final Meter getRequests = Metrics.newMeter(WebProxy.class, "get-requests", "requests", TimeUnit.SECONDS);
getRequests.mark();
getRequests.mark(requests.size());
A meter requires two additional pieces of information besides the name: the event type and the rate unit. The event type simply describes the type of events which the meter is measuring. In the above case, the meter is measuring proxied requests, and so its event type is "requests". The rate unit is the unit of time denominating the rate. In the above case, the meter is measuring the number of requests in each second, and so its rate unit is SECONDS. When combined, the meter is measuring requests per second.
Meters measure the rate of the events in a few different ways. The mean rate is the average rate of events. It’s generally useful for trivia, but as it represents the total rate for your application’s entire lifetime (e.g., the total number of requests handled, divided by the number of seconds the process has been running), it doesn’t offer a sense of recency. Luckily, meters also record three different exponentially-weighted moving average rates: the 1-, 5-, and 15-minute moving averages.
Hint
Just like the Unix load averages visible in uptime or top.
A timer is basically a histogram of the duration of a type of event and a meter of the rate of its occurrence.
final Timer timer = Metrics.newTimer(WebProxy.class, "get-requests", TimeUnit.MILLISECONDS, TimeUnit.SECONDS);

final TimerContext context = timer.time();
try {
    // handle request
} finally {
    context.stop();
}
A timer requires two additional pieces of information besides the name: the duration unit and the rate unit. The duration unit is the unit of time in which the durations of events will be measured. In the above example, the duration unit is MILLISECONDS, meaning the timed event’s duration will be measured in milliseconds. The rate unit in the above example is SECONDS, meaning the rate of the timed event is measured in calls/sec.
Note
Regardless of the display duration unit of a timer, elapsed time for its events is measured internally in nanoseconds, using Java’s high-precision System.nanoTime() method.
Metrics also provides you with a consistent, unified way of performing application health checks. A health check is basically a small self-test which your application performs to verify that a specific component or responsibility is performing correctly.
To create a health check, extend the HealthCheck class:
public class DatabaseHealthCheck extends HealthCheck {
    private final Database database;

    public DatabaseHealthCheck(Database database) {
        super("database");
        this.database = database;
    }

    @Override
    protected Result check() throws Exception {
        if (database.ping()) {
            return Result.healthy();
        }
        return Result.unhealthy("Can't ping database");
    }
}
In this example, we’ve created a health check for a Database class on which our application depends. Our fictitious Database class has a #ping() method, which executes a safe test query (e.g., SELECT 1). #ping() returns true if the query returns the expected result, returns false if it returns something else, and throws an exception if things have gone seriously wrong.
Our DatabaseHealthCheck, then, takes a Database instance and in its #check() method, attempts to ping the database. If it can, it returns a healthy result. If it can’t, it returns an unhealthy result.
Note
Exceptions thrown inside a health check’s #check() method are automatically caught and turned into unhealthy results with the full stack trace.
To register a health check, either use the HealthChecks singleton or a HealthCheckRegistry instance:
HealthChecks.register(new DatabaseHealthCheck(database));
You can also run the set of registered health checks:
for (Entry<String, Result> entry : HealthChecks.run().entrySet()) {
    if (entry.getValue().isHealthy()) {
        System.out.println(entry.getKey() + ": PASS");
    } else {
        System.out.println(entry.getKey() + ": FAIL");
    }
}
Reporters are the way that your application exports all the measurements being made by its metrics. metrics-core comes with three ways of exporting your metrics: JMX, console, and CSV.
By default, Metrics always registers your metrics as JMX MBeans. To explore this you can use VisualVM (which ships with most JDKs as jvisualvm) with the VisualVM-MBeans plugins installed or JConsole (which ships with most JDKs as jconsole):
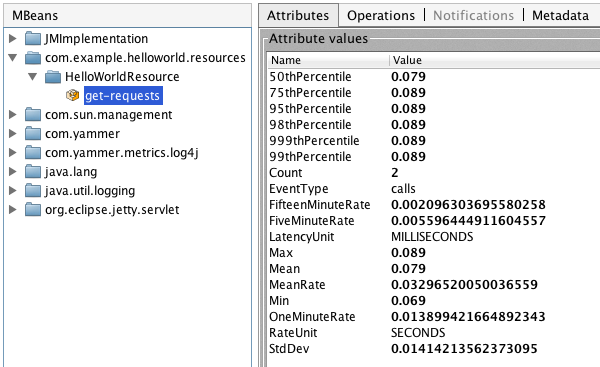
Tip
If you double-click any of the metric properties, VisualVM will start graphing the data for that property. Sweet, eh?
Reporting via JMX is always enabled, but we don’t recommend that you try to gather metrics from your production environment. JMX’s RPC API is fragile and bonkers. For development purposes and browsing, though, it can be very useful.
For simple benchmarks, Metrics comes with ConsoleReporter, which periodically reports all registered metrics to the console:
ConsoleReporter.enable(1, TimeUnit.SECONDS);
For more complex benchmarks, Metrics comes with CsvReporter, which periodically appends to a set of .csv files in a given directory:
CsvReporter.enable(new File("work/measurements"), 1, TimeUnit.SECONDS);
For each metric registered, a .csv file will be created, and every second its state will be written to it as a new row.
Metrics has other reporter implementations, too: