
Getting Started will guide you through the process of adding Metrics to an existing application. We’ll go through the various measuring instruments that Metrics provides, how to use them, and when they’ll come in handy.
You need the metrics-core library as a dependency:
<dependencies>
    <dependency>
        <groupId>io.dropwizard.metrics</groupId>
        <artifactId>metrics-core</artifactId>
        <version>${metrics.version}</version>
    </dependency>
</dependencies>
Note
Make sure you have a metrics.version property declared in your POM with the current version,
which is 3.1.0.
Now it’s time to add some metrics to your application!
A meter measures the rate of events over time (e.g., “requests per second”). In addition to the mean rate, meters also track 1-, 5-, and 15-minute moving averages.
private final Meter requests = metrics.meter("requests");

public void handleRequest(Request request, Response response) {
    requests.mark();
    // etc
}
This meter will measure the rate of requests in requests per second.
A Console Reporter is exactly what it sounds like - report to the console. This reporter will print every second.
ConsoleReporter reporter = ConsoleReporter.forRegistry(metrics)
       .convertRatesTo(TimeUnit.SECONDS)
       .convertDurationsTo(TimeUnit.MILLISECONDS)
       .build();
   reporter.start(1, TimeUnit.SECONDS);
So the complete Getting Started is
  package sample;
  import com.codahale.metrics.*;
  import java.util.concurrent.TimeUnit;

  public class GetStarted {
    static final MetricRegistry metrics = new MetricRegistry();
    public static void main(String args[]) {
      startReport();
      Meter requests = metrics.meter("requests");
      requests.mark();
      wait5Seconds();
    }

  static void startReport() {
      ConsoleReporter reporter = ConsoleReporter.forRegistry(metrics)
          .convertRatesTo(TimeUnit.SECONDS)
          .convertDurationsTo(TimeUnit.MILLISECONDS)
          .build();
      reporter.start(1, TimeUnit.SECONDS);
  }

  static void wait5Seconds() {
      try {
          Thread.sleep(5*1000);
      }
      catch(InterruptedException e) {}
  }
}
<?xml version="1.0" encoding="UTF-8"?>
<project xmlns="http://maven.apache.org/POM/4.0.0" xmlns:xsi="http://www.w3.org/2001/XMLSchema-instance" xsi:schemaLocation="http://maven.apache.org/POM/4.0.0 http://maven.apache.org/xsd/maven-4.0.0.xsd">
  <modelVersion>4.0.0</modelVersion>

  <groupId>somegroup</groupId>
  <artifactId>sample</artifactId>
  <version>0.0.1-SNAPSHOT</version>
  <name>Example project for Metrics</name>

  <dependencies>
    <dependency>
      <groupId>io.dropwizard.metrics</groupId>
      <artifactId>metrics-core</artifactId>
      <version>${metrics.version}</version>
    </dependency>
  </dependencies>
</project>
Note
Make sure you have a metrics.version property declared in your POM with the current version,
which is 3.1.0.
To run
mvn package exec:java -Dexec.mainClass=sample.First
The centerpiece of Metrics is the MetricRegistry class, which is the container for all your
application’s metrics. Go ahead and create a new one:
final MetricRegistry metrics = new MetricRegistry();
You’ll probably want to integrate this into your application’s lifecycle (maybe using your
dependency injection framework), but static field is fine.
A gauge is an instantaneous measurement of a value. For example, we may want to measure the number of pending jobs in a queue:
public class QueueManager {
    private final Queue queue;

    public QueueManager(MetricRegistry metrics, String name) {
        this.queue = new Queue();
        metrics.register(MetricRegistry.name(QueueManager.class, name, "size"),
                         new Gauge<Integer>() {
                             @Override
                             public Integer getValue() {
                                 return queue.size();
                             }
                         });
    }
}
When this gauge is measured, it will return the number of jobs in the queue.
Every metric in a registry has a unique name, which is just a dotted-name string like
"things.count" or "com.example.Thing.latency". MetricRegistry has a static helper method
for constructing these names:
MetricRegistry.name(QueueManager.class, "jobs", "size")
This will return a string with something like "com.example.QueueManager.jobs.size".
For most queue and queue-like structures, you won’t want to simply return queue.size(). Most of
java.util and java.util.concurrent have implementations of #size() which are O(n),
which means your gauge will be slow (potentially while holding a lock).
A counter is just a gauge for an AtomicLong instance. You can increment or decrement its value.
For example, we may want a more efficient way of measuring the pending job in a queue:
private final Counter pendingJobs = metrics.counter(name(QueueManager.class, "pending-jobs"));

public void addJob(Job job) {
    pendingJobs.inc();
    queue.offer(job);
}

public Job takeJob() {
    pendingJobs.dec();
    return queue.take();
}
Every time this counter is measured, it will return the number of jobs in the queue.
As you can see, the API for counters is slightly different: #counter(String) instead of
#register(String, Metric). While you can use register and create your own Counter
instance, #counter(String) does all the work for you, and allows you to reuse metrics with the
same name.
Also, we’ve statically imported MetricRegistry‘s name method in this scope to reduce
clutter.
A histogram measures the statistical distribution of values in a stream of data. In addition to minimum, maximum, mean, etc., it also measures median, 75th, 90th, 95th, 98th, 99th, and 99.9th percentiles.
private final Histogram responseSizes = metrics.histogram(name(RequestHandler.class, "response-sizes"));

public void handleRequest(Request request, Response response) {
    // etc
    responseSizes.update(response.getContent().length);
}
This histogram will measure the size of responses in bytes.
A timer measures both the rate that a particular piece of code is called and the distribution of its duration.
private final Timer responses = metrics.timer(name(RequestHandler.class, "responses"));

public String handleRequest(Request request, Response response) {
    final Timer.Context context = responses.time();
    try {
        // etc;
        return "OK";
    } finally {
        context.stop();
    }
}
This timer will measure the amount of time it takes to process each request in nanoseconds and provide a rate of requests in requests per second.
Metrics also has the ability to centralize your service’s health checks with the
metrics-healthchecks module.
First, create a new HealthCheckRegistry instance:
final HealthCheckRegistry healthChecks = new HealthCheckRegistry();
Second, implement a HealthCheck subclass:
public class DatabaseHealthCheck extends HealthCheck {
    private final Database database;

    public DatabaseHealthCheck(Database database) {
        this.database = database;
    }

    @Override
    public HealthCheck.Result check() throws Exception {
        if (database.isConnected()) {
            return HealthCheck.Result.healthy();
        } else {
            return HealthCheck.Result.unhealthy("Cannot connect to " + database.getUrl());
        }
    }
}
Then register an instance of it with Metrics:
healthChecks.register("postgres", new DatabaseHealthCheck(database));
To run all of the registered health checks:
final Map<String, HealthCheck.Result> results = healthChecks.runHealthChecks();
for (Entry<String, HealthCheck.Result> entry : results.entrySet()) {
    if (entry.getValue().isHealthy()) {
        System.out.println(entry.getKey() + " is healthy");
    } else {
        System.err.println(entry.getKey() + " is UNHEALTHY: " + entry.getValue().getMessage());
        final Throwable e = entry.getValue().getError();
        if (e != null) {
            e.printStackTrace();
        }
    }
}
Metrics comes with a pre-built health check: ThreadDeadlockHealthCheck, which uses Java’s
built-in thread deadlock detection to determine if any threads are deadlocked.
To report metrics via JMX:
final JmxReporter reporter = JmxReporter.forRegistry(registry).build();
reporter.start();
Once the reporter is started, all of the metrics in the registry will become visible via JConsole or VisualVM (if you install the MBeans plugin):
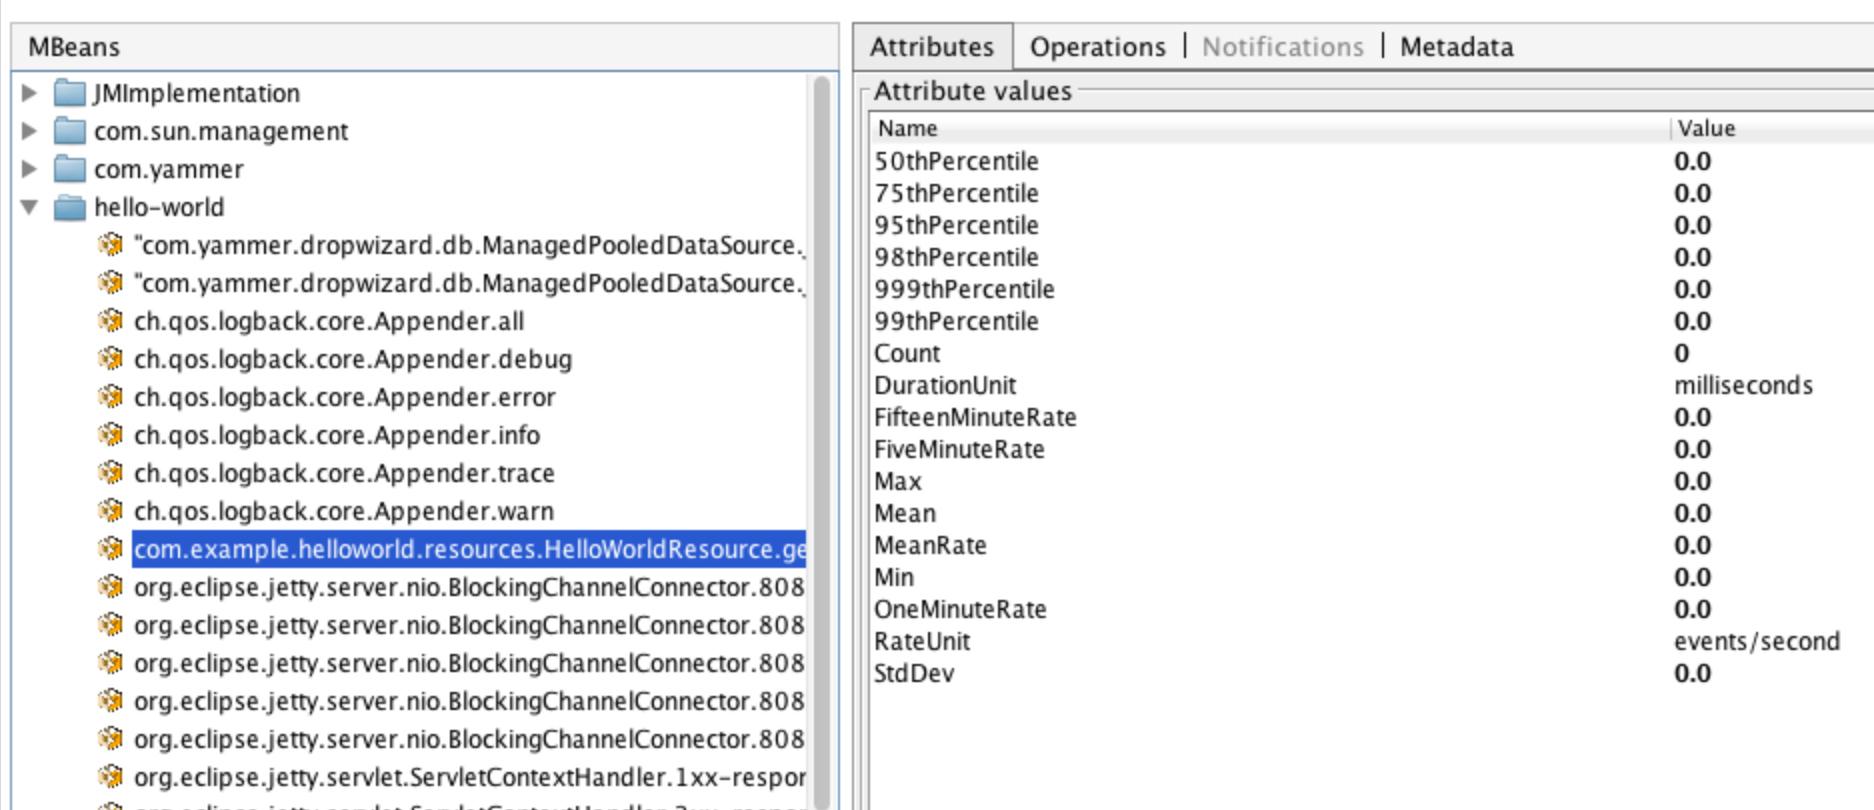
Tip
If you double-click any of the metric properties, VisualVM will start graphing the data for that property. Sweet, eh?
Metrics also ships with a servlet (AdminServlet) which will serve a JSON representation of all
registered metrics. It will also run health checks, print out a thread dump, and provide a simple
“ping” response for load-balancers. (It also has single servlets–MetricsServlet,
HealthCheckServlet, ThreadDumpServlet, and PingServlet–which do these individual
tasks.)
To use this servlet, include the metrics-servlets module as a dependency:
<dependency>
    <groupId>io.dropwizard.metrics</groupId>
    <artifactId>metrics-servlets</artifactId>
    <version>${metrics.version}</version>
</dependency>
Note
Make sure you have a metrics.version property declared in your POM with the current version,
which is 3.1.0.
From there on, you can map the servlet to whatever path you see fit.
In addition to JMX and HTTP, Metrics also has reporters for the following outputs:
STDOUT, using ConsoleReporter from metrics-coreCSV files, using CsvReporter from metrics-coremetrics-coremetrics-gangliametrics-graphite